Beyond the Joyeuse Christmas celebrations, the holiday season casts a notable influence on financial markets and trends. In this article we shall delve into the intricate relationship between holidays and financial dynamics. The Santa Claus Rally is the tendency of the stock market to increase during the Christmas season. Hypotheses include increased holiday shopping and institutional investors balancing their portfolios ahead of holiday leave. It is important to take into consideration that the Santa Claus Rally may also be random and does not imply any future guarantees.
Yale Hirsch, the founder of the Stock Trader’s Almanac, discovered and coined the “Santa Claus Rally” in 1972. The Stock Trader’s Almanac compiled data examining the period from 1952 through 1971 and showed that a Santa Claus rally occurred 17 times out of 20 years (or roughly 80% of the time), with growth in the S&P 500 by 1.4%, over the six days comprised of the last four rather than five trading days of the outgoing year and the first two trading days of the new year. During these seven weeks, the S&P 500 has historically demonstrated a 79.2% higher stock prices, surpassing the average performance observed over a typical period of 7 days.
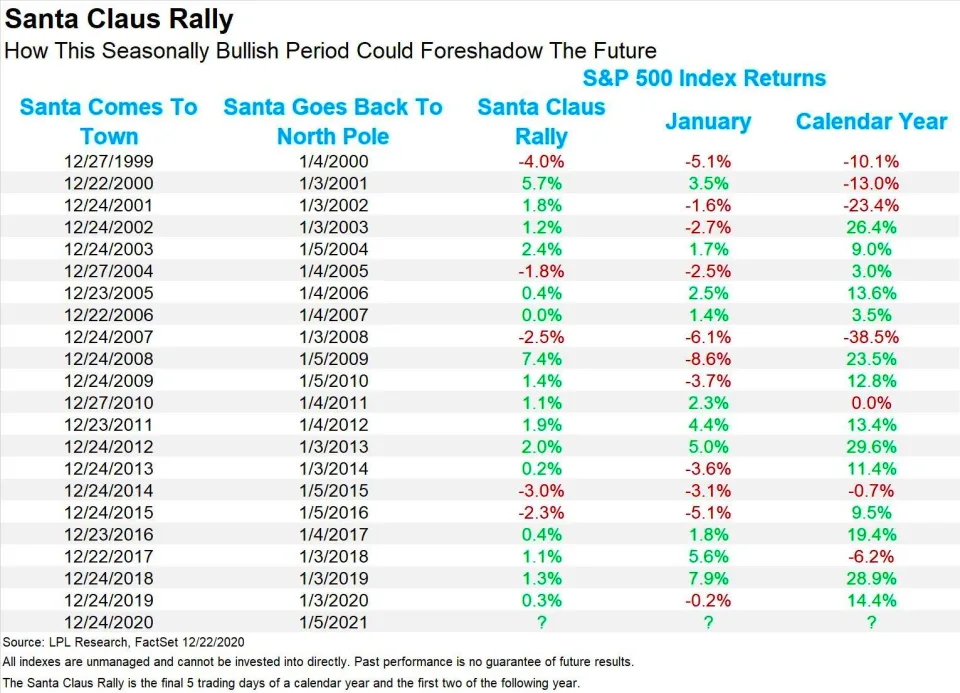
According to The Wall Street Journal, historically, the S&P 500, the Dow Jones Industrial Average (DJIA), and the Nasdaq Composite have risen about 80% of the time during the Santa Claus rally period. The average returns for the S&P 500, the Dow, and the Nasdaq Composite over the period have been 1.3%, 1.4%, and 1.8%, respectively. However, the original Santa Claus rally analysis does not meet basic standards of academic rigor. A study published in the Journal of Financial Planning in 2015 attempted to correct for this lack of rigor by testing for statistical significance. It examined three major U.S. stock indices: the Russell 2000, S&P 500 and Nasdaq Composite. The study also examined returns in 15 other developed countries, so the total sample included eight countries where the majority of residents identify as Christian and eight don’t. This study found that the Santa Claus effect is, in fact, real. Not only that, but it achieved this by eliminating the positive influence of a possible January effect. It only analyzed returns for the four or five trading days, depending on the year, between Christmas and New Year’s. Although other studies deny the existence of such a phenomenon, theoretically, to meet the “rally” definition, returns merely need to be positive. Thus, one can say the market has enjoyed a Santa Claus rally whether the return was 7.2% over that period, as it was in 1974, or 0.0003%, as it was in 2006.
Several theories try to explain the Santa Claus rally, including: investor optimism fueled by the holiday spirit, increased holiday shopping, lower trading volumes and the investing of holiday bonuses. Another theory is that this is the time of year when institutional investors go on vacation, leaving the market to retail investors, who tend to be more bullish. In fact, the two major U.S. stock exchanges, the New York Stock Exchange (NYSE) and the Nasdaq are closed on Christmas day.
So the causes for this event can be found in multiple circumstances: fund managers may engage in window dressing, a practice where they buy high-performing stocks to make their portfolios look better at the end of the year, or even investors looking to reduce their taxable gains and rebalance their portfolios often sell stocks that have lost value, a practice called tax-loss harvesting. This large-scale selling, it’s theorized, depresses many stocks’ prices and sets the stage for year-end gains. Human psychology could definitely be at play with the Santa Claus effect, too. People expect stocks to rise and want to benefit from the rally. So they buy stocks, causing them to rally.
All in all, there seems to be many contrasting positions on the existence of the Rally, whether it may be true, some sort of Placebo effect or it actually never occurred.
But, what about this year? With two weeks to go before we close out 2023, stocks have come charging back: the Dow Jones industrial average closing above 37,000 and reaching a new all-time high; the S&P 500 rising to within 1.6 percent of its all-time high, reached on January 3, 2022, and is up more than 22 percent on the year, and the Nasdaq Composite, the biggest loser of 2022, charging ahead by more than 40 percent on the year.
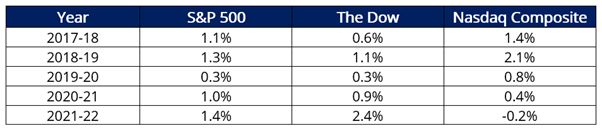
Source: Dow Jones Market Data, The Wall Street Journal
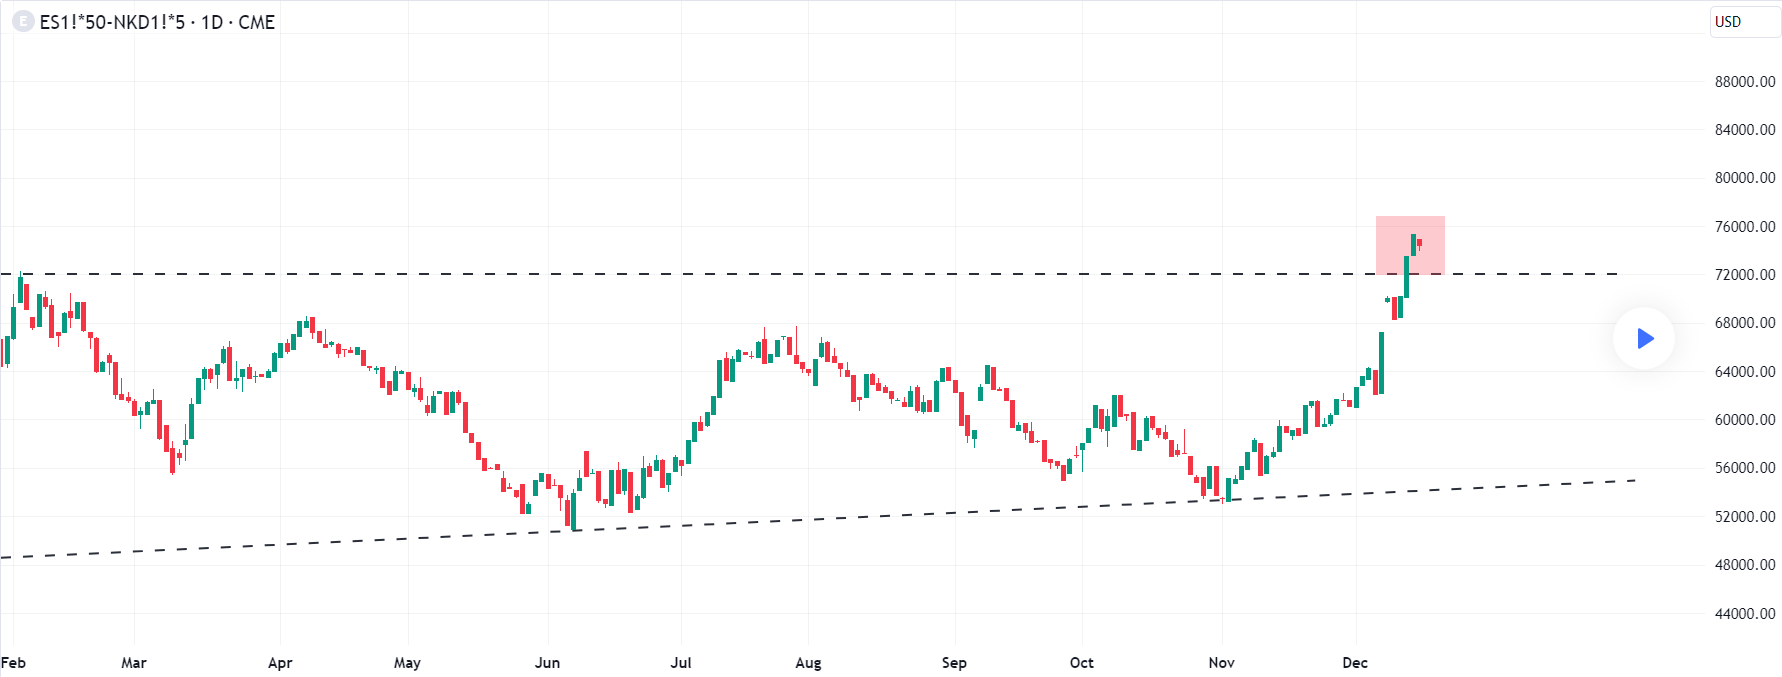
From: Trading View, current S&P 500 – Nikkei 225 of 2023
Author: Liliana Prina